- Image via Wikipedia
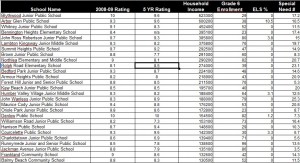
The table below shows the top rated schools in Toronto based on Fraser Institute. Click on Table to View.
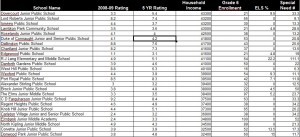
and here are some of the schools rated the lowest in Toronto based on Fraser Institute
There seems to be a direct relationship between school rating and average household income of students in that school. The performance of a school in general significantly drops when the average household income is less than $45,000.
Top Schools in Toronto
| School Name | 2008-09 Rating | 5 YR Rating | Household Income | Grade 6 Enrollment | ELS % | Special Need # |
| Blythwood Junior Public School | 10 | 9.6 | 623300 | 29 | 0 | 17.2 |
| Arbor Glen Public School | 9.3 | 9.6 | 600200 | 38 | 10.5 | 10.5 |
| Whitney Junior Public School | 9.1 | 8.3 | 452400 | 52 | 0 | 11.5 |
| Bennington Heights Elementary School | 8.4 | n/a | 395100 | 23 | 0 | 17.4 |
| John Ross Robertson Junior Public School | 9.7 | 9.3 | 385800 | 80 | 3.8 | 15 |
| Lambton Kingsway Junior Middle School | 8.3 | 8.2 | 375800 | 76 | 0 | 19.7 |
| Summit Heights Public School | 9.7 | 9.2 | 292500 | 47 | 0 | 14.9 |
| Brown Junior Public School | 8.8 | 7.7 | 291000 | 60 | 0 | 8.3 |
| Northlea Elementary and Middle School | 9 | 8.1 | 290200 | 82 | 0 | 20.7 |
| Rolph Road Elementary School | 8.1 | 8.5 | 274000 | 39 | 0 | 23.1 |
| Bedford Park Junior Public School | 9.3 | 8.7 | 224100 | 48 | 0 | 14.6 |
| Armour Heights Public School | 8.2 | 8 | 218900 | 43 | 0 | 20.9 |
| Forest Hill Junior and Senior Public School | 8.8 | 8.5 | 211500 | 76 | 0 | 5.3 |
| Kew Beach Junior Public School | 8.5 | 8.5 | 195700 | 40 | 0 | 20 |
| Humber Valley Village Junior Middle School | 8.3 | 8.2 | 188400 | 64 | 3.1 | 12.5 |
| John Wanless Junior Public School | 8.3 | 8.9 | 188000 | 79 | 0 | 25.3 |
| Maurice Cody Junior Public School | 9.4 | 8.8 | 176200 | 53 | 0 | 20.8 |
| Oriole Park Junior Public School | 9.8 | 8.6 | 172800 | 23 | 0 | 8.7 |
| Denlow Public School | 10 | 10 | 154500 | 82 | 1.2 | 7.3 |
| Williamson Road Junior Public School | 8.2 | 7.3 | 153100 | 73 | 0 | 16.4 |
| Harrison Public School | 8.7 | 9.4 | 148600 | 29 | 0 | 10.3 |
| Courcelette Public School | 9.3 | 9.6 | 142300 | 30 | 3.3 | 6.7 |
| Charlottetown Junior Public School | 8.6 | 6.9 | 139400 | 71 | 0 | 5.6 |
| Runnymede Junior and Senior Public School | 8.5 | 7.8 | 138500 | 96 | 0 | 13.5 |
| Jackman Avenue Junior Public School | 8.8 | 7.9 | 135100 | 86 | 0 | 3.5 |
| Frankland Community School | 9 | 8.6 | 132600 | 42 | 0 | 14.3 |
| Balmy Beach Community School | 8.8 | 8.3 | 130500 | 52 | 0 | 11.5 |
| Rippleton Public School | 8.1 | 9.5 | 102300 | 39 | 10.3 | 15.4 |
Low Scoring Schools in Toronto
| School Name | 2008-09 Rating | 5 YR Rating | Household Income | Grade 6 Enrollment | ELS % | Special Need # |
| Dovercourt Junior Public School | 3.3 | 5.4 | 43300 | 21 | 9.5 | 33.3 |
| Lord Roberts Junior Public School | 8.2 | 7.4 | 43200 | 55 | 0 | 9.1 |
| Ionview Public School | 4.4 | 3.7 | 43200 | 30 | 0 | 13.3 |
| Lambton Park Community School | 3.5 | 3.6 | 43000 | 21 | 4.8 | 28.6 |
| Roselands Junior Public School | 4.1 | 4 | 42500 | 38 | 0 | 13.2 |
| Duke of Connaught Junior and Senior Public School | 4.1 | 4.2 | 41800 | 53 | 0 | 20.8 |
| Dallington Public School | 8.8 | 7.6 | 41700 | 43 | 0 | 25.6 |
| Chartland Junior Public School | 8.2 | 7.3 | 41600 | 37 | 0 | 13.5 |
| Edgewood Public School | 1.1 | 3.1 | 41600 | 21 | 4.8 | 19 |
| R J Lang Elementary and Middle School | 4.9 | 5.1 | 41100 | 54 | 22.2 | 111.1 |
| Danforth Gardens Public School | 3.9 | 4.6 | 41000 | 50 | 0 | 22 |
| West Hill Public School | 8.8 | 6.3 | 40100 | 16 | 0 | 6.3 |
| Wexford Public School | 4.4 | 3.9 | 39900 | 54 | 9.3 | 11.1 |
| Port Royal Public School | 8.5 | 8.3 | 39500 | 42 | 7.1 | 11.9 |
| Alexander Stirling Public School | 3 | 3.2 | 39400 | 32 | 0 | 12.5 |
| Brock Junior Public School | 3.8 | 4.8 | 38900 | 22 | 4.5 | 50 |
| The Elms Junior Middle School | 3.3 | 3.5 | 38400 | 97 | 5.2 | 23.7 |
| C D Farquharson Junior Public School | 9.2 | 8.4 | 37500 | 63 | 0 | 33.3 |
| Regent Heights Public School | 4.6 | 4.9 | 37400 | 38 | 0 | 34.2 |
| Knob Hill Junior Public School | 4.4 | 5.1 | 37300 | 65 | 0 | 26.2 |
| Carleton Village Junior and Senior Public School | 2.4 | 3.2 | 36900 | 38 | 0 | 34.2 |
| Elmbank Junior Middle Academy | 2.4 | 3.3 | 34800 | 100 | 6 | 52 |
| North Kipling Junior Middle School | 4.9 | 4.3 | 34500 | 89 | 0 | 21.3 |
| Corvette Junior Public School | 3.9 | 3.9 | 32500 | 52 | 13.5 | 17.3 |
| Donwood Park Junior Public School | 3.8 | 4.8 | 32400 | 60 | 15 | 11.7 |
| Eastview Junior Public School | 3.1 | 3 | 30600 | 47 | 0 | 42.6 |
| Perth Avenue Junior Public School | 2.9 | 2.1 | 30600 | 23 | 0 | 35.1 |
| Charles E Webster Junior Public School | 4.5 | 4.3 | 29600 | 45 | 15.6 | 31.1 |
| Mason Road Junior Public School | 3.9 | 3.2 | 29400 | 58 | 0 | 39.7 |
| Highland Heights Junior Public School | 2 | 3.8 | 29400 | 32 | 0 | 21.9 |
| Willow Park Junior Public School | 3.5 | 4.5 | 29100 | 42 | 0 | 40.5 |
| Greenholme Junior Middle School | 2.7 | 2.9 | 28600 | 55 | 5.5 | 38.2 |
| Queen Victoria Junior Public School | 3.8 | 4.4 | 26600 | 94 | 11.7 | 18.1 |
| 2.5 | 3.5 | 25400 | 38 | 15.8 | 21.1 | |
| Pringdale Gardens Junior Public School | 3.4 | 4.2 | 24700 | 47 | 2.1 | 14.9 |
| Cedar Drive Junior Public School | 4.5 | 4.8 | 23400 | 83 | 4.8 | 20.5 |
| Chester Le Junior Public School | 2.9 | 4.3 | 20900 | 25 | 0 | 40 |
| Warden Avenue Public School | 3.4 | 3.8 | 19300 | 35 | 6.7 | 24.4 |
| Regent Park/Duke of York Junior Public School | 2.4 | 2.6 | 19100 | 45 | 2.2 | 35.6 |
| Sprucecourt Junior Public School | 3.8 | 4.5 | 16200 | 41 | 0 | 19.1 |
| Nelson Mandela Park Public School | 3.2 | 3.6 | 13600 | 43 | 0 | 30.2 |


