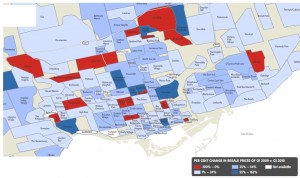
- Toronto House Price Changes From 2008-2009

- Largest House Price Changes From 2009-2009

- Largest House Price Losses in Toronto Between 2008-2009
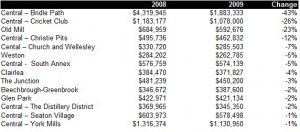
Neighbourhoods with Largest Drop in House Prices
| |
2008 |
2009 |
Change |
| Central Bridle Path |
$4,319,945 |
$1,883,333 |
-43% |
| Central Cricket Club |
$1,183,177 |
$1,078,000 |
-26% |
| Old Mill |
$684,959 |
$592,676 |
-23% |
| Central Christie Pits |
$495,736 |
$462,832 |
-12% |
| Central Church and Wellesley |
$330,720 |
$285,503 |
-7% |
| Weston |
$284,202 |
$262,785 |
-5% |
| Central South Annex |
$576,759 |
$574,139 |
-5% |
| Clairlea |
$384,470 |
$371,827 |
-4% |
| The Junction |
$481,239 |
$450,200 |
-3% |
| Beechbrough Greenbrook |
$346,672 |
$387,600 |
-2% |
| Glen Park |
$422,971 |
$421,134 |
-2% |
| Central The Distillery District |
$369,965 |
$345,350 |
-2% |
| Central Seaton Village |
$603,973 |
$578,498 |
-1% |
| Central York Mills |
$1,316,374 |
$1,130,950 |
-1% |
Neighbourhoods with Largest Gains in House Prices
| |
2008 |
2009 |
Change |
| Central Hoggs Hollow |
$1,507,974 |
$1,958,600 |
163% |
| Central Casa Loma |
$699,312 |
$905,000 |
107% |
| Humewood Cedarvale |
$661,519 |
$787,001 |
91% |
| Central St. Andrew-Windfields |
$1,053,568 |
$1,530,250 |
77% |
| Rosedale |
$1,096,340 |
$1,651,206 |
68% |
| Richview |
$327,465 |
$383,212 |
67% |
| Swansea |
$538,359 |
$582,407 |
63% |
| Central Financial District |
$273,516 |
$380,671 |
63% |
| Central South Hill |
$1,433,608 |
$1,173,111 |
55% |


