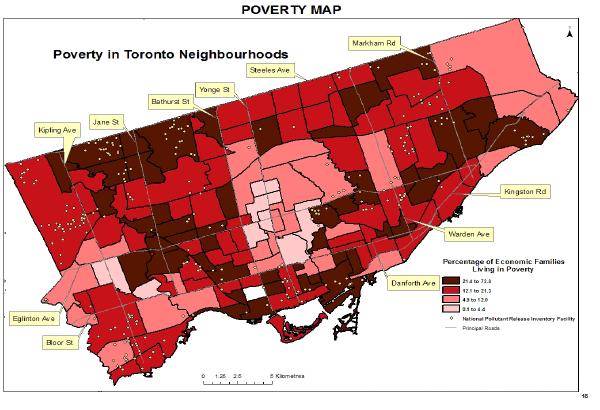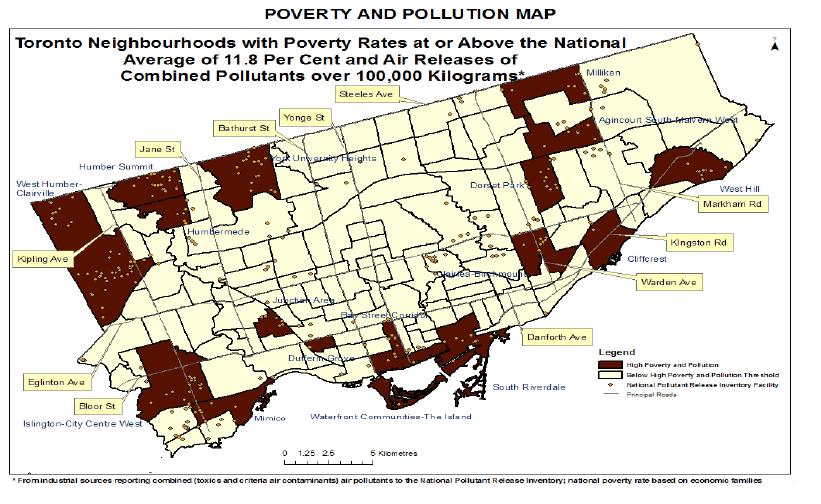
Many of us are well aware of the gap between rich and poor in this country and many of us in general believe our society is caring. This might well be true but lets examine Toronto social economic boundaries and the trend in the past couple of decades in terms of poverty and pollution.

A study done in 2004 by United Way Toronto and Canadian Council on Social Development called Poverty by Postal Code has shown a significant increase in the number of higher poverty neighbourhoods in Toronto over 20 years period. This should be alarming given the role neighbourhoods play in contributing to the overall fulfillment of social, recreational and service needs in the community.
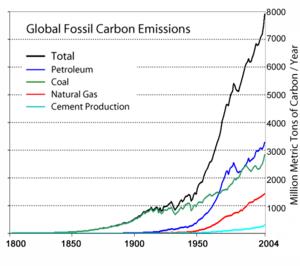
The air pollutants listed below are the root cause of many cardio-respiratory illnesses in the city and these are generated by fossil fuel consumption.
Air Pollutants
| Abbreviation | Description |
|---|---|
| SOx | Sulphur |
| Nox | Nitrogen Oxides |
| PM | Particulate Matter |
| CO | Carbon Monoxide |
| Pb | Lead |
| O3 | Ground-level ozone |
Top 15 census tracts in Toronto with the highest amounts of air releases of toxic air pollutants in 2005 (kg)
Top 15 census tracts in Toronto
| Name of Neighbourhood containing Census Tract | Census Tract Number | Poverty Rate of Census Tract (%) | Air Releases of Toxic Air Pollutants in 2005 (kg) |
|---|---|---|---|
| Alderwood | 211 | 6.4 | 279,825 |
| Humbermede | 313 | 16 | 275,205 |
| Humber summit | 315.03 | 17.9 | 272,215 |
| Humber summit | 315.01 | 15.8 | 259,460 |
| West Humber | 247.01 | 16.4 | 249,472 |
| West Hill | 360 | 12.8 | 182,571 |
| Cliffcrest | 335 | 21.2 | 158,720 |
| Clairlea-Birchmont | 347 | 12.5 | 124,266 |
| Clairlea-Birchmont | 348 | 11.2 | 107,084 |
| Agincourt-Malvern | 377.02 | 15.4 | 105,965 |
| Islington-City Centre | 214 | 6.7 | 100,040 |
| York University Heights | 311.06 | 39.5 | 98,624 |
| Milliken | 378.19 | 17.9 | 91,197 |
| Eringate | 236.02 | 7.1 | 78,831 |
| Junction Area | 106 | 27.3 | 67,574 |
| Total - top 15 | 2,451,049 | ||
| Total all census tracts in Toronto | 2,819,466 | ||
| Top 15 as % of all Toronto | 86.90% |
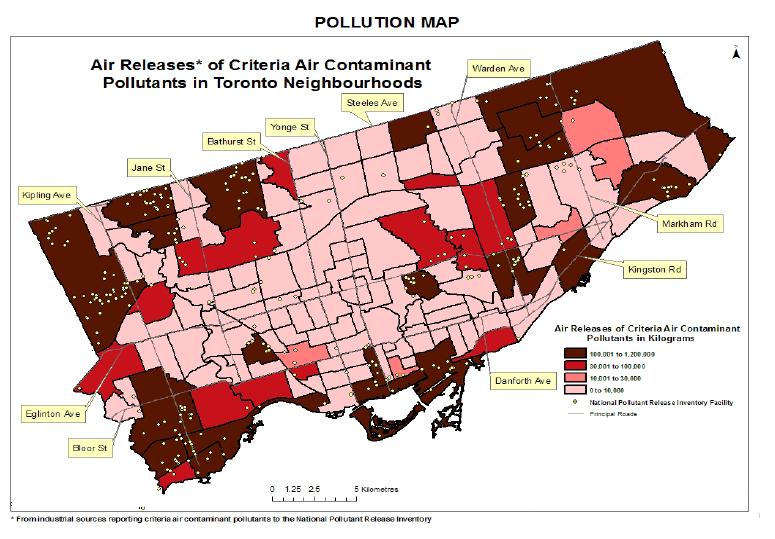
The map below shows the air pollution levels across Toronto. In particular a group of air pollutants called Criteria Air Contaminants (CAC), these pollutants are the main cause of smog, acid rain and other health hazards. The map below shows the air pollution levels across Toronto.
We need to be more responsible and understand the long term effects of slow response to this issue. As our population ages health problems will likely grow as a result and one way or another we as tax payers and residents of this beautiful city will end up paying the cost. What is your thoughts on this?


![Reblog this post [with Zemanta]](http://img.zemanta.com/reblog_e.png?x-id=a020490a-ab8c-4d21-95d6-5c00a2bb222a)


