House Price Changes Across Toronto Between 2008 and 2009

- Toronto House Price Changes From 2008-2009


- Largest House Price Changes From 2009-2009


- Largest House Price Losses in Toronto Between 2008-2009

Neighbourhoods with Largest Drop in House Prices
| 2008 | 2009 | Change | |
|---|---|---|---|
| Central Bridle Path | $4,319,945 | $1,883,333 | -43% |
| Central Cricket Club | $1,183,177 | $1,078,000 | -26% |
| Old Mill | $684,959 | $592,676 | -23% |
| Central Christie Pits | $495,736 | $462,832 | -12% |
| Central Church and Wellesley | $330,720 | $285,503 | -7% |
| Weston | $284,202 | $262,785 | -5% |
| Central South Annex | $576,759 | $574,139 | -5% |
| Clairlea | $384,470 | $371,827 | -4% |
| The Junction | $481,239 | $450,200 | -3% |
| Beechbrough Greenbrook | $346,672 | $387,600 | -2% |
| Glen Park | $422,971 | $421,134 | -2% |
| Central The Distillery District | $369,965 | $345,350 | -2% |
| Central Seaton Village | $603,973 | $578,498 | -1% |
| Central York Mills | $1,316,374 | $1,130,950 | -1% |
Neighbourhoods with Largest Gains in House Prices
| 2008 | 2009 | Change | |
|---|---|---|---|
| Central Hoggs Hollow | $1,507,974 | $1,958,600 | 163% |
| Central Casa Loma | $699,312 | $905,000 | 107% |
| Humewood Cedarvale | $661,519 | $787,001 | 91% |
| Central St. Andrew-Windfields | $1,053,568 | $1,530,250 | 77% |
| Rosedale | $1,096,340 | $1,651,206 | 68% |
| Richview | $327,465 | $383,212 | 67% |
| Swansea | $538,359 | $582,407 | 63% |
| Central Financial District | $273,516 | $380,671 | 63% |
| Central South Hill | $1,433,608 | $1,173,111 | 55% |
The City Action Plan

There are times when you wonder how much of taxes goes towards studies and committees and how effective they are. In June 2006, the Mayor’s Economic Competitive Advisory Committee came together to develop a plan of action to make Toronto a global business city. A city that sets the standard for how global cities innovate to solve urban and metropolitan challenges such as climate change, energy conversation and efficiency, human wellness and security. A hub of environmental innovation and a beacon for diversity and cohesion
Read the rest of this entry »
Toronto G20 Summit – June 26, 27
The cost of two day G20 summit conference in Toronto on June 26, 27 is expected to reach $1 Billion. Almost all the bill is covered by the Federal government.
Vehicular traffic restriction zone covers the area south of King St. W., between Spadina Ave. and Yonge St.. Access to street portions inside the Controlled Access Zone will be closed. The restriction will not apply to Emergency vehicles.
A Community Relations Group has been setup to listen to all people and organizations that are affected by hosting of G20 Summit. The group can be reached at 1-888-446-4047 or by email, [email protected].
Read the rest of this entry »
Toronto Public School Ratings and Household Income

- Image via Wikipedia
The table below shows the top rated schools in Toronto based on Fraser Institute. Click on Table to View.

- Top Rated Schools

and here are some of the schools rated the lowest in Toronto based on Fraser Institute

- Bottom Rated Schools in Toronto

There seems to be a direct relationship between school rating and average household income of students in that school. The performance of a school in general significantly drops when the average household income is less than $45,000.
Top Schools in Toronto
| School Name | 2008-09 Rating | 5 YR Rating | Household Income | Grade 6 Enrollment | ELS % | Special Need # |
| Blythwood Junior Public School | 10 | 9.6 | 623300 | 29 | 0 | 17.2 |
| Arbor Glen Public School | 9.3 | 9.6 | 600200 | 38 | 10.5 | 10.5 |
| Whitney Junior Public School | 9.1 | 8.3 | 452400 | 52 | 0 | 11.5 |
| Bennington Heights Elementary School | 8.4 | n/a | 395100 | 23 | 0 | 17.4 |
| John Ross Robertson Junior Public School | 9.7 | 9.3 | 385800 | 80 | 3.8 | 15 |
| Lambton Kingsway Junior Middle School | 8.3 | 8.2 | 375800 | 76 | 0 | 19.7 |
| Summit Heights Public School | 9.7 | 9.2 | 292500 | 47 | 0 | 14.9 |
| Brown Junior Public School | 8.8 | 7.7 | 291000 | 60 | 0 | 8.3 |
| Northlea Elementary and Middle School | 9 | 8.1 | 290200 | 82 | 0 | 20.7 |
| Rolph Road Elementary School | 8.1 | 8.5 | 274000 | 39 | 0 | 23.1 |
| Bedford Park Junior Public School | 9.3 | 8.7 | 224100 | 48 | 0 | 14.6 |
| Armour Heights Public School | 8.2 | 8 | 218900 | 43 | 0 | 20.9 |
| Forest Hill Junior and Senior Public School | 8.8 | 8.5 | 211500 | 76 | 0 | 5.3 |
| Kew Beach Junior Public School | 8.5 | 8.5 | 195700 | 40 | 0 | 20 |
| Humber Valley Village Junior Middle School | 8.3 | 8.2 | 188400 | 64 | 3.1 | 12.5 |
| John Wanless Junior Public School | 8.3 | 8.9 | 188000 | 79 | 0 | 25.3 |
| Maurice Cody Junior Public School | 9.4 | 8.8 | 176200 | 53 | 0 | 20.8 |
| Oriole Park Junior Public School | 9.8 | 8.6 | 172800 | 23 | 0 | 8.7 |
| Denlow Public School | 10 | 10 | 154500 | 82 | 1.2 | 7.3 |
| Williamson Road Junior Public School | 8.2 | 7.3 | 153100 | 73 | 0 | 16.4 |
| Harrison Public School | 8.7 | 9.4 | 148600 | 29 | 0 | 10.3 |
| Courcelette Public School | 9.3 | 9.6 | 142300 | 30 | 3.3 | 6.7 |
| Charlottetown Junior Public School | 8.6 | 6.9 | 139400 | 71 | 0 | 5.6 |
| Runnymede Junior and Senior Public School | 8.5 | 7.8 | 138500 | 96 | 0 | 13.5 |
| Jackman Avenue Junior Public School | 8.8 | 7.9 | 135100 | 86 | 0 | 3.5 |
| Frankland Community School | 9 | 8.6 | 132600 | 42 | 0 | 14.3 |
| Balmy Beach Community School | 8.8 | 8.3 | 130500 | 52 | 0 | 11.5 |
| Rippleton Public School | 8.1 | 9.5 | 102300 | 39 | 10.3 | 15.4 |
Low Scoring Schools in Toronto
| School Name | 2008-09 Rating | 5 YR Rating | Household Income | Grade 6 Enrollment | ELS % | Special Need # |
| Dovercourt Junior Public School | 3.3 | 5.4 | 43300 | 21 | 9.5 | 33.3 |
| Lord Roberts Junior Public School | 8.2 | 7.4 | 43200 | 55 | 0 | 9.1 |
| Ionview Public School | 4.4 | 3.7 | 43200 | 30 | 0 | 13.3 |
| Lambton Park Community School | 3.5 | 3.6 | 43000 | 21 | 4.8 | 28.6 |
| Roselands Junior Public School | 4.1 | 4 | 42500 | 38 | 0 | 13.2 |
| Duke of Connaught Junior and Senior Public School | 4.1 | 4.2 | 41800 | 53 | 0 | 20.8 |
| Dallington Public School | 8.8 | 7.6 | 41700 | 43 | 0 | 25.6 |
| Chartland Junior Public School | 8.2 | 7.3 | 41600 | 37 | 0 | 13.5 |
| Edgewood Public School | 1.1 | 3.1 | 41600 | 21 | 4.8 | 19 |
| R J Lang Elementary and Middle School | 4.9 | 5.1 | 41100 | 54 | 22.2 | 111.1 |
| Danforth Gardens Public School | 3.9 | 4.6 | 41000 | 50 | 0 | 22 |
| West Hill Public School | 8.8 | 6.3 | 40100 | 16 | 0 | 6.3 |
| Wexford Public School | 4.4 | 3.9 | 39900 | 54 | 9.3 | 11.1 |
| Port Royal Public School | 8.5 | 8.3 | 39500 | 42 | 7.1 | 11.9 |
| Alexander Stirling Public School | 3 | 3.2 | 39400 | 32 | 0 | 12.5 |
| Brock Junior Public School | 3.8 | 4.8 | 38900 | 22 | 4.5 | 50 |
| The Elms Junior Middle School | 3.3 | 3.5 | 38400 | 97 | 5.2 | 23.7 |
| C D Farquharson Junior Public School | 9.2 | 8.4 | 37500 | 63 | 0 | 33.3 |
| Regent Heights Public School | 4.6 | 4.9 | 37400 | 38 | 0 | 34.2 |
| Knob Hill Junior Public School | 4.4 | 5.1 | 37300 | 65 | 0 | 26.2 |
| Carleton Village Junior and Senior Public School | 2.4 | 3.2 | 36900 | 38 | 0 | 34.2 |
| Elmbank Junior Middle Academy | 2.4 | 3.3 | 34800 | 100 | 6 | 52 |
| North Kipling Junior Middle School | 4.9 | 4.3 | 34500 | 89 | 0 | 21.3 |
| Corvette Junior Public School | 3.9 | 3.9 | 32500 | 52 | 13.5 | 17.3 |
| Donwood Park Junior Public School | 3.8 | 4.8 | 32400 | 60 | 15 | 11.7 |
| Eastview Junior Public School | 3.1 | 3 | 30600 | 47 | 0 | 42.6 |
| Perth Avenue Junior Public School | 2.9 | 2.1 | 30600 | 23 | 0 | 35.1 |
| Charles E Webster Junior Public School | 4.5 | 4.3 | 29600 | 45 | 15.6 | 31.1 |
| Mason Road Junior Public School | 3.9 | 3.2 | 29400 | 58 | 0 | 39.7 |
| Highland Heights Junior Public School | 2 | 3.8 | 29400 | 32 | 0 | 21.9 |
| Willow Park Junior Public School | 3.5 | 4.5 | 29100 | 42 | 0 | 40.5 |
| Greenholme Junior Middle School | 2.7 | 2.9 | 28600 | 55 | 5.5 | 38.2 |
| Queen Victoria Junior Public School | 3.8 | 4.4 | 26600 | 94 | 11.7 | 18.1 |
| 2.5 | 3.5 | 25400 | 38 | 15.8 | 21.1 | |
| Pringdale Gardens Junior Public School | 3.4 | 4.2 | 24700 | 47 | 2.1 | 14.9 |
| Cedar Drive Junior Public School | 4.5 | 4.8 | 23400 | 83 | 4.8 | 20.5 |
| Chester Le Junior Public School | 2.9 | 4.3 | 20900 | 25 | 0 | 40 |
| Warden Avenue Public School | 3.4 | 3.8 | 19300 | 35 | 6.7 | 24.4 |
| Regent Park/Duke of York Junior Public School | 2.4 | 2.6 | 19100 | 45 | 2.2 | 35.6 |
| Sprucecourt Junior Public School | 3.8 | 4.5 | 16200 | 41 | 0 | 19.1 |
| Nelson Mandela Park Public School | 3.2 | 3.6 | 13600 | 43 | 0 | 30.2 |
Related articles by Zemanta
EQAO

- Image via Wikipedia

What level am I going to end up with for math? For literacy? The ideology within society is that children are stress free but children experience stress at a very young age. It’s not just at one stage but throughout their elementary to high school. And what is causing them to stress? EQAO. Education Quality and Accountability Office. EQAO is a provincial agency. The agency makes assessments for children in Grade 3, 6, 9 and 10. The test is supposed to test the curriculum children have learned in these grades as well as provide diagnostic information of how and children are doing to the child, parents, school and the school board. The assessments in grades 3 and 6 are focused on reading, writing and math. In grade 9, students are assessed in math and in grade 10 on literacy. The test began due to calls from the public as well as parents questioning what children are learning in the curriculum to school boards.
How are children graded on the EQAO? The EQAO results gives a level for each category ( mathematics, writing and reading). These levels are from Level 1 to Level 4. Level 1 defines that the child’s skill in the strand is below the provincial standard. Level 2 defines the child’s skill is close to the provincial standard. Level 3 defines that the child’s skills meets the provincial standard. Lastly, level 4 defines that the child is well above the provincial standard. How has the EQAO impacted children, parents, teachers and the school in positive and negative ways? Well, firstly, the EQAO can act as an indicator to show where the child is having difficulties. Teachers than are able to focus on improving the child’s skills in that specific strand. The test also shows if children are overall understanding the curriculum taught and if not it allows schools to work with their teachers and sort out the curriculum in a way which will allow children to understand it better. Parents are also aware of where their children are standing with their skills in reading, writing and mathematics. Children who love a challenge will enjoy the EQAO test. Read the rest of this entry »
Toronto Mayor in 2010
Who do you have in your mind? Who do you think can make a difference for the city of Toronto? Who is the mayor you have in mind? That’s right. It’s that time again, where we elect our new mayor for Toronto after seven years. In order to consider which mayor would make Toronto a better city we need to know each of the candidates running for the position of Toronto’s Mayor. We also, as residents of Toronto need to let the candidates know what we want changed in Toronto. We elect them which means we need to voice our concerns and suggestions for our city.
On October 25 2010, the municipal election will be held in Toronto. The municipal election is to elect a mayor for the city as well as city councillors and school trustees. This year a mayor will be elected as well as 44 city councillors. School Trustees will also be elected for the Toronto District School Board, Conseil scolaire de district du Centre- Sud-Ouest, Conseil scolaire de district catholique Centre-Sud and Toronto Catholic District School Board. Let’s take a brief look at some of the candidates.
The mayor is the officer that is the highest ranked within a municipal government. The mayor takes responsibility to insure the city is running well.
Rob Ford was born in in 1969 and is a city councillor in Toronto. He represents one of the Etobicoke North wards, which is Ward 2. Ford is Doug Ford’s son who was a Member of the Provincial Parliament. Ford has been living in Toronto since birth. Ford is a member of the Salvation Army’s Red Shield Appeal, Heart and Stroke Foundation, Toronto Board of Trade and the Toronto West Rotary Club, Terry Fox Foundation and the Etobicoke Chamber of Commerce. Ford has given $20,000 out of his own pockets to fund equipments for football and a high school and has began a foundation to help fund other schools who are struggling with football equipments. He is active within football programs believing it is a good way for at-risk kids to involve themselves in something positive. As a councillor, he continuously has proposed ideas to cut back on the spending that are used by city politicians. He has made headlines for using the least amount of money compared to other councillors for his councillor office expenses. He has also brought up the issues of councillors who have a tax free status to Revenue Canada. With this matter, on April 30, 2010, the city councillors were told to pay for their bus passes which was a freebie before. Read the rest of this entry »
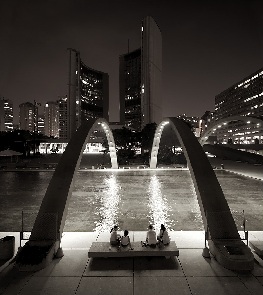
Must go in Toronto
Thinking of visiting Toronto? Or haven’t explored Toronto properly even though you live in Toronto? What places are some of Toronto’s best places to see? Toronto, being a very busy city, has many attractions that you wouldn’t want to miss.
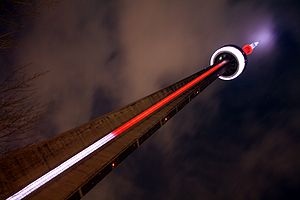
What better way, than to visit what Toronto is known for- The CN Tower. The CN Tower is one of the world’s tallest buildings. Being over 1800 feet, the Tower attracts about two million people every year. There are many attractions such as The Look Out level which has an amazing view from a height of 346m. Want some adventure while at the tour? The Glass Floor is a thrilling experience. The thickness of the Glass floor is 2 ½. Looking 1,122m downward can be a scary feeling, but don’t worry the glass is secured. Other attractions include the Sky Pod, Movies and many more attractions at each level. You can also have an amazing meal at the Tower. CN Tower’s 360 The Restaurant, has a beautiful view, looking down more than 351 metres. The restaurant itself is one of Toronto’s finest dining places. The CN Tower also consists of the world’s highest wine cellar, which holds over 550 Canadian as well as international wines. You can also visit the gift shop for souvenirs. The Tower is located on Front Street.
The Toronto Islands is another beautiful place to visit in Toronto. The island consists of a ferry ride before reaching the islands. The islands consist of walking trails, small beach, and picnic areas as well as boat rentals. Many people visit Centreville Amusement Park. The amusement park has over 30 rides and attractions and is a fun place for the kids. Read the rest of this entry »
Gardner Expressway’s Thirst for Oil

We all know our society is heavily dependent on gas and vehicles and it is doubtful things will change anytime soon. But have you ever wondered why it takes 2,500 – 5,000 lbs of steel to carry an average person who weighs no more than 170 lbs. What is all this weight? Engine, chassis, body, seats, fuel, radio etc.
How much gas is used to carry this weight around? 14-22 mpg for an average SUV and 25-36 mpg for an average family car. These numbers are usually based on tests done in a lab or under perfect conditions, no wind or cargo. But realistically, the consumption is higher.
Lets take Gardner Expressway, which is just 11 miles in length with average weekday traffic volume of 120,000 vehicles. Read the rest of this entry »
Summer Fun @ CNE
With two more months of school left till the kids head of into their summer vacation, parents are probably getting a head start of planning the summer activities the family is going to do. Brining the kids to the beach, the zoo or signing them up for camp is common. But what are kids excited about and looking forward to in the summer? What are they going to be talking about the whole summer? They’re going to be talking about going to The Ex.
Being the largest annual fair in Canada as well as the fourth largest fair in North America, CNE (Canadian National Exhibition), is an 18 day fair that occurs in late August. CNE attracts about 1.3 million people within the 18 days of the fair. The fair includes Canadian as well as international performers, games for children, and concerts for children/adults as well as different type of shows. There are more than 50 attractions and more than 80 games at the fair. There are over 95 food vendors from across the world at CNE as well. Every year the fair holds the Canadian International Air show. The air show is the largest show in the world that is over-the-water. The Snowbirds which is Canada’s number one precision flying team is featured in the show as well.
Best Meals in Toronto
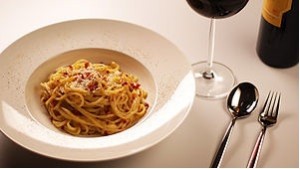
After a tired day at work, we don’t usually feel like cooking. Why not treat yourself to some of Toronto’s best restaurants? There are many great restaurants in Toronto with delicious dishes. Which restaurants are a must dine? Well here are some of the best known restaurants in Toronto:
Being in the tallest building in the world as well as the highest restaurant in the world, 360 Revolving Restaurant is a must dine. While dinning in, you are surrounded by the gorgeous view being 1, 100 feet above the city. Being in CN Tower, the restaurant is the world’s highest award winning wine cellar. 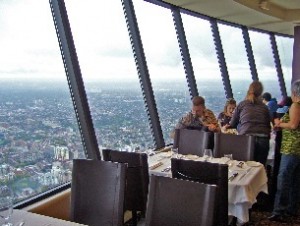 They restaurant has more than 500 Canadian and international wine. The goal of the restaurant is to use fresh Ontario produce as well as the best ingredients Canada has to offer in their dishes. The restaurant consists of top chefs preparing amazing meal that will blow your mind away.
Truffles is the first restaurant in Canada that received the CAA/AAA Five Diamond Award. The restaurant has many delicious dishes on its menus. The dishes include variety of American and Mediterranean dishes that are created by Canadian chefs.
Read the rest of this entry »


